IBM Data Science Capstone Project
Analyzing the Neighborhoods in Dubai for setting up a
New Fast Food Restaurant
IBM Applied Data Science Capstone
Project
By: Ahmad Kanbari
2021-6-12

Since the first of January 2021, I have been working
to achieve an IBM Data Science Professional certification, It took me 6 months
to reach this level. The course teaches what it means to be a data scientist and the tools that you need to succeed in this field. The classes included
Python programming, SQL databases, machine learning, statistics, and more. As a
Capstone for the certification, students are required to define a business
problem and pull data from the web and location data from Foursquare to solve
it. This report details my process for determining the best spot in Dubai to
open a Fast Food Restaurant or a food truck, from problem statement to data
preparation to analysis to recommendations. Detailed code for this project is
located on GitHub and can be found at the end of this post.
1- Introduction
1.1- Business Problem
Food is a
lucrative business industry and the Middle East is the hub of delicious
culinary delights from all over the world. Nowadays with covid-19
presence, Fast-food restaurants have proven to provide safe and quick meals to
people on the go and offer an alternative to traditional, sit-down restaurants.
Imagine you have opened a fast-food restaurant or a food truck whether its
Western fast-food style where you serve burgers and drinks or it's a middle
eastern style where you sell shawarma, falafel, and other sandwiches. By following
the food code of UAE and choosing the right place, This business will be so
profitable as it provides tasty food in a quick, low-cost manner.
Before opening
a fast-food restaurant, however, researches the city and determine if your fast-food business has enough potential demand from the population. So what
factors should you analyze to determine the best place in the city to start
your fast food restaurant, and how do you do it? This report outlines some
basic assumptions, data sets, and analyses that can inform your decision when
selecting the optimal neighborhood in Dubai for opening a Fast Food restaurant
or your food truck.
1.2- Target Audience
The target audience of this report would be anyone who wants to buy or build a fast food
restaurant or fast food truck in Dubai.
2- Data
The dataset that I
used in this project is of Dubai communities scrapped from Wikipedia. This
dataset contains a list of 153 communities of Dubai.
Data source:
https://en.wikipedia.org/wiki/List_of_communities_in_Dubai
I scrapped the data
from the table of Wikipedia using a python library called ‘Beautiful soup’. We
will use only 4 columns of the dataset i.e. Community Number, Community
(English) and Community (Arabic) for venue analysis of Dubai and the population
density column. Following data sources will be needed to extract/generate the
required information:
- I Will use the GEOPY python library to generate
Latitude and Longitude for the Abu Dhabi Island
- I Will use the GEOCODER python library to geocode
coordinates (Latitudes and Longitude for schools in Abu Dhabi.
- number of venues and their type and location in
every neighborhood will be obtained using FOURSQUARE API
3 – Methodology
3.1- The first step in this
project is to scrap the data from Wikipedia page then clean it up by dropping
unnecessary columns, renaming the remaining columns, and getting rid of NaN
values.
We can grab this data and place it into a pandas
data frame using python. This is going to help us clean and analyze it to
generate insights.
As we see the data contains 153 records and 7
columns
Let’s clean up the data and delete unnecessary columns and
Nan values and makes it ready for analysis. The result table :

Now after cleaning it has 153 records and 4 columns

3.2- The second step is to
get the longitude and latitude of Dubai city and each neighborhood in Dubai by
using geopy python libraries.
Let’s show the top five Neighborhoods
with their longitude and latitude data.

3.2.1-Then we can create a map that shows all our
Neighborhoods in Dubai
Folium library was used to visualize a map of Dubai and
neighborhoods were superimposed on top of it as in the picture below:

Then I used Foursquare API to explore areas around
center of each neighborhood and find the 10 most common venues in each
neighborhood. I've set the radius of search to 500 meters around the center of
each neighborhood and limit to 100 venues.
Foursquare
data is robust and provides location data for Apple and Uber. Foursquare API
will allow us to retrieve information about the most popular spots in each
neighborhood in San Francisco. This will be an insightful indication of foot
traffic for different venue types. Calling the Foursquare API returns a JSON
file, which can be turned into a data frame for analysis in a python notebook.
But Let me first
explore AlAwir first neighborhood in Dubai:

By using FourSquar API and getting The results, clean it and categorize it wi will get
a result table of all venues in Al Awir first neighborhood and their categories:

4-
This will lead us to the 4th step which is doing the same process for each
neighborhood in Dubai :
This is an
example of the data resulting from the analysis using foursquare API:

The result was 544 venues returned by Foursquare
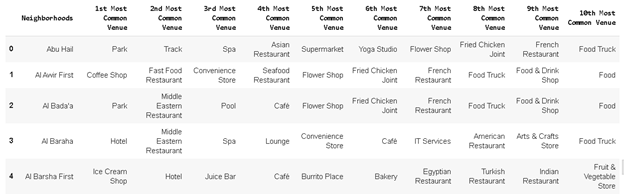
in Dubai. The next step was to create a table, which shows a list of the top 10 venues
for each Borough:
5- In the fifth step we will
analyze the data, by digging further into each of the neighborhoods to see the
most popular types of venues for each neighborhood. To do this, we will take
the following steps:
- Create a data frame of
venue categories with pandas one-hot encoding
- Use pandas group by to
get the mean of the one-hot encoded venue categories
- Transpose the data
frame and arrange in descending order
The result table will contain 80 records(Neighborhoods) and
147 Category type:

The table will look like that :


The code
provides us with the top 5 venues for each neighborhood:

This data is important because it is giving us an idea of the atmosphere of each of these neighborhoods. That helps us to know whether any location is already a hot spot for other fast-food restaurants and food trucks. So, I’m going to create several data frames from this information and use them to examine the atmosphere of our potential neighborhoods.
Let’s try to know more about Neighborhoods by Knowing the 10
most common venues categories in each Neighborhood.

The result
will be looks like that :
6- In the sixth step we will use machine learning and use K-means clustering algorithm to group neighborhoods into 5 distinct groups, based on the top 10 venues in each neighborhood. By clustering our neighborhoods based on their popular venue categories This will help us get a feel for which neighborhoods are like each other based on the venues people like to visit in each one.
The results of the K-Means algorithm will result in the
following table:

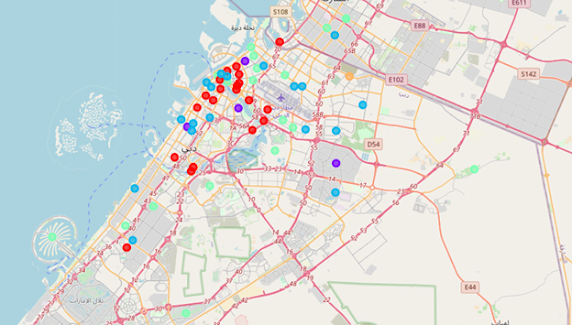
Let’s visualize
the clusters using folium python library:
7- After clustering, we will select neighborhoods where parks are one of the most first 3 venue categories and try to find the ideal neighborhood for our business.
The best Neighborhood to open a fast
food restaurant will be a place where many people can gather from different
places in Dubai, so neighborhoods where parks and shopping centers are located
will be better for a fast food restaurant or food truck, for being able to
reach the maximum number of possible customers. also within those
neighborhoods the ideal neighborhood will have the highest population density.

Let’s merge
our table with the df_Dubai table to add population density columns to our existing
table. the result will be : (some columns are not shown)

Solution :
Option 1: Choosing the ideal place based on less competition.
for this option, we are going to use cluster 0 to choose the ideal neighborhood where
food trucks and fast food restaurants are not among the 10 most common venues
category.
As The above table provided the
Mirdif neighborhood is
the only place where there are no food trucks or fast-food restaurants as the ideal
neighborhood.
Selecting this
neighborhood may lead to the rapid growth of your business due to lack of
competition and due to be near a park.
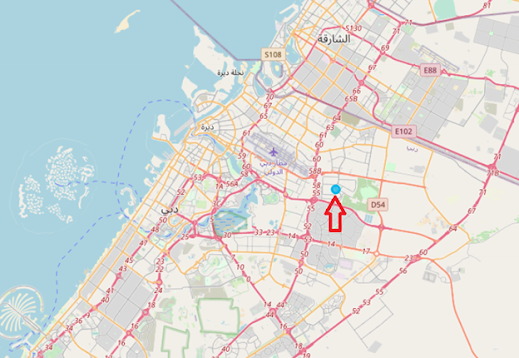
Let’s show
the location of the Mirdif neighborhood :
Option2: choosing ideal place only based on
population density
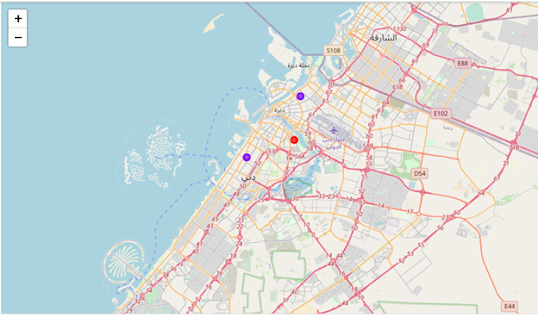
let's sort our
neighborhoods on population densities (population per area) in descending order
and select the top 3 neighborhoods that contain park among 1st,2nd, and 3rd most
common venues and have the highest population density.

Let’s show their locations :
Discussion Section
The major purpose of this project is to
suggest the ideal neighborhood in Dubai for who wants to open a fast food
restaurant or a food truck. being near popular venues where people get
together, checking for population density and competitiveness are among
important factors to choose the ideal neighborhood.
Results
If you want to choose the ideal neighborhood where the competition is low you should go with Mirdif
neighborhood. If you care more about population density you can choose among
top neighborhoods where population density is high such as Al
Babaji, Abu Hail or
Umm Hurair First.
Conclusion
Foursquare
data and K-means algorithm, alongside folium mapping tools, can be powerful
tools helping people decide the best places for doing such a business. where Data is
the driver of the decision. This approach can be replicated for various other
tasks, e.g. comparing two different cities or choosing the best neighborhood to
live in.
Comments
Post a Comment